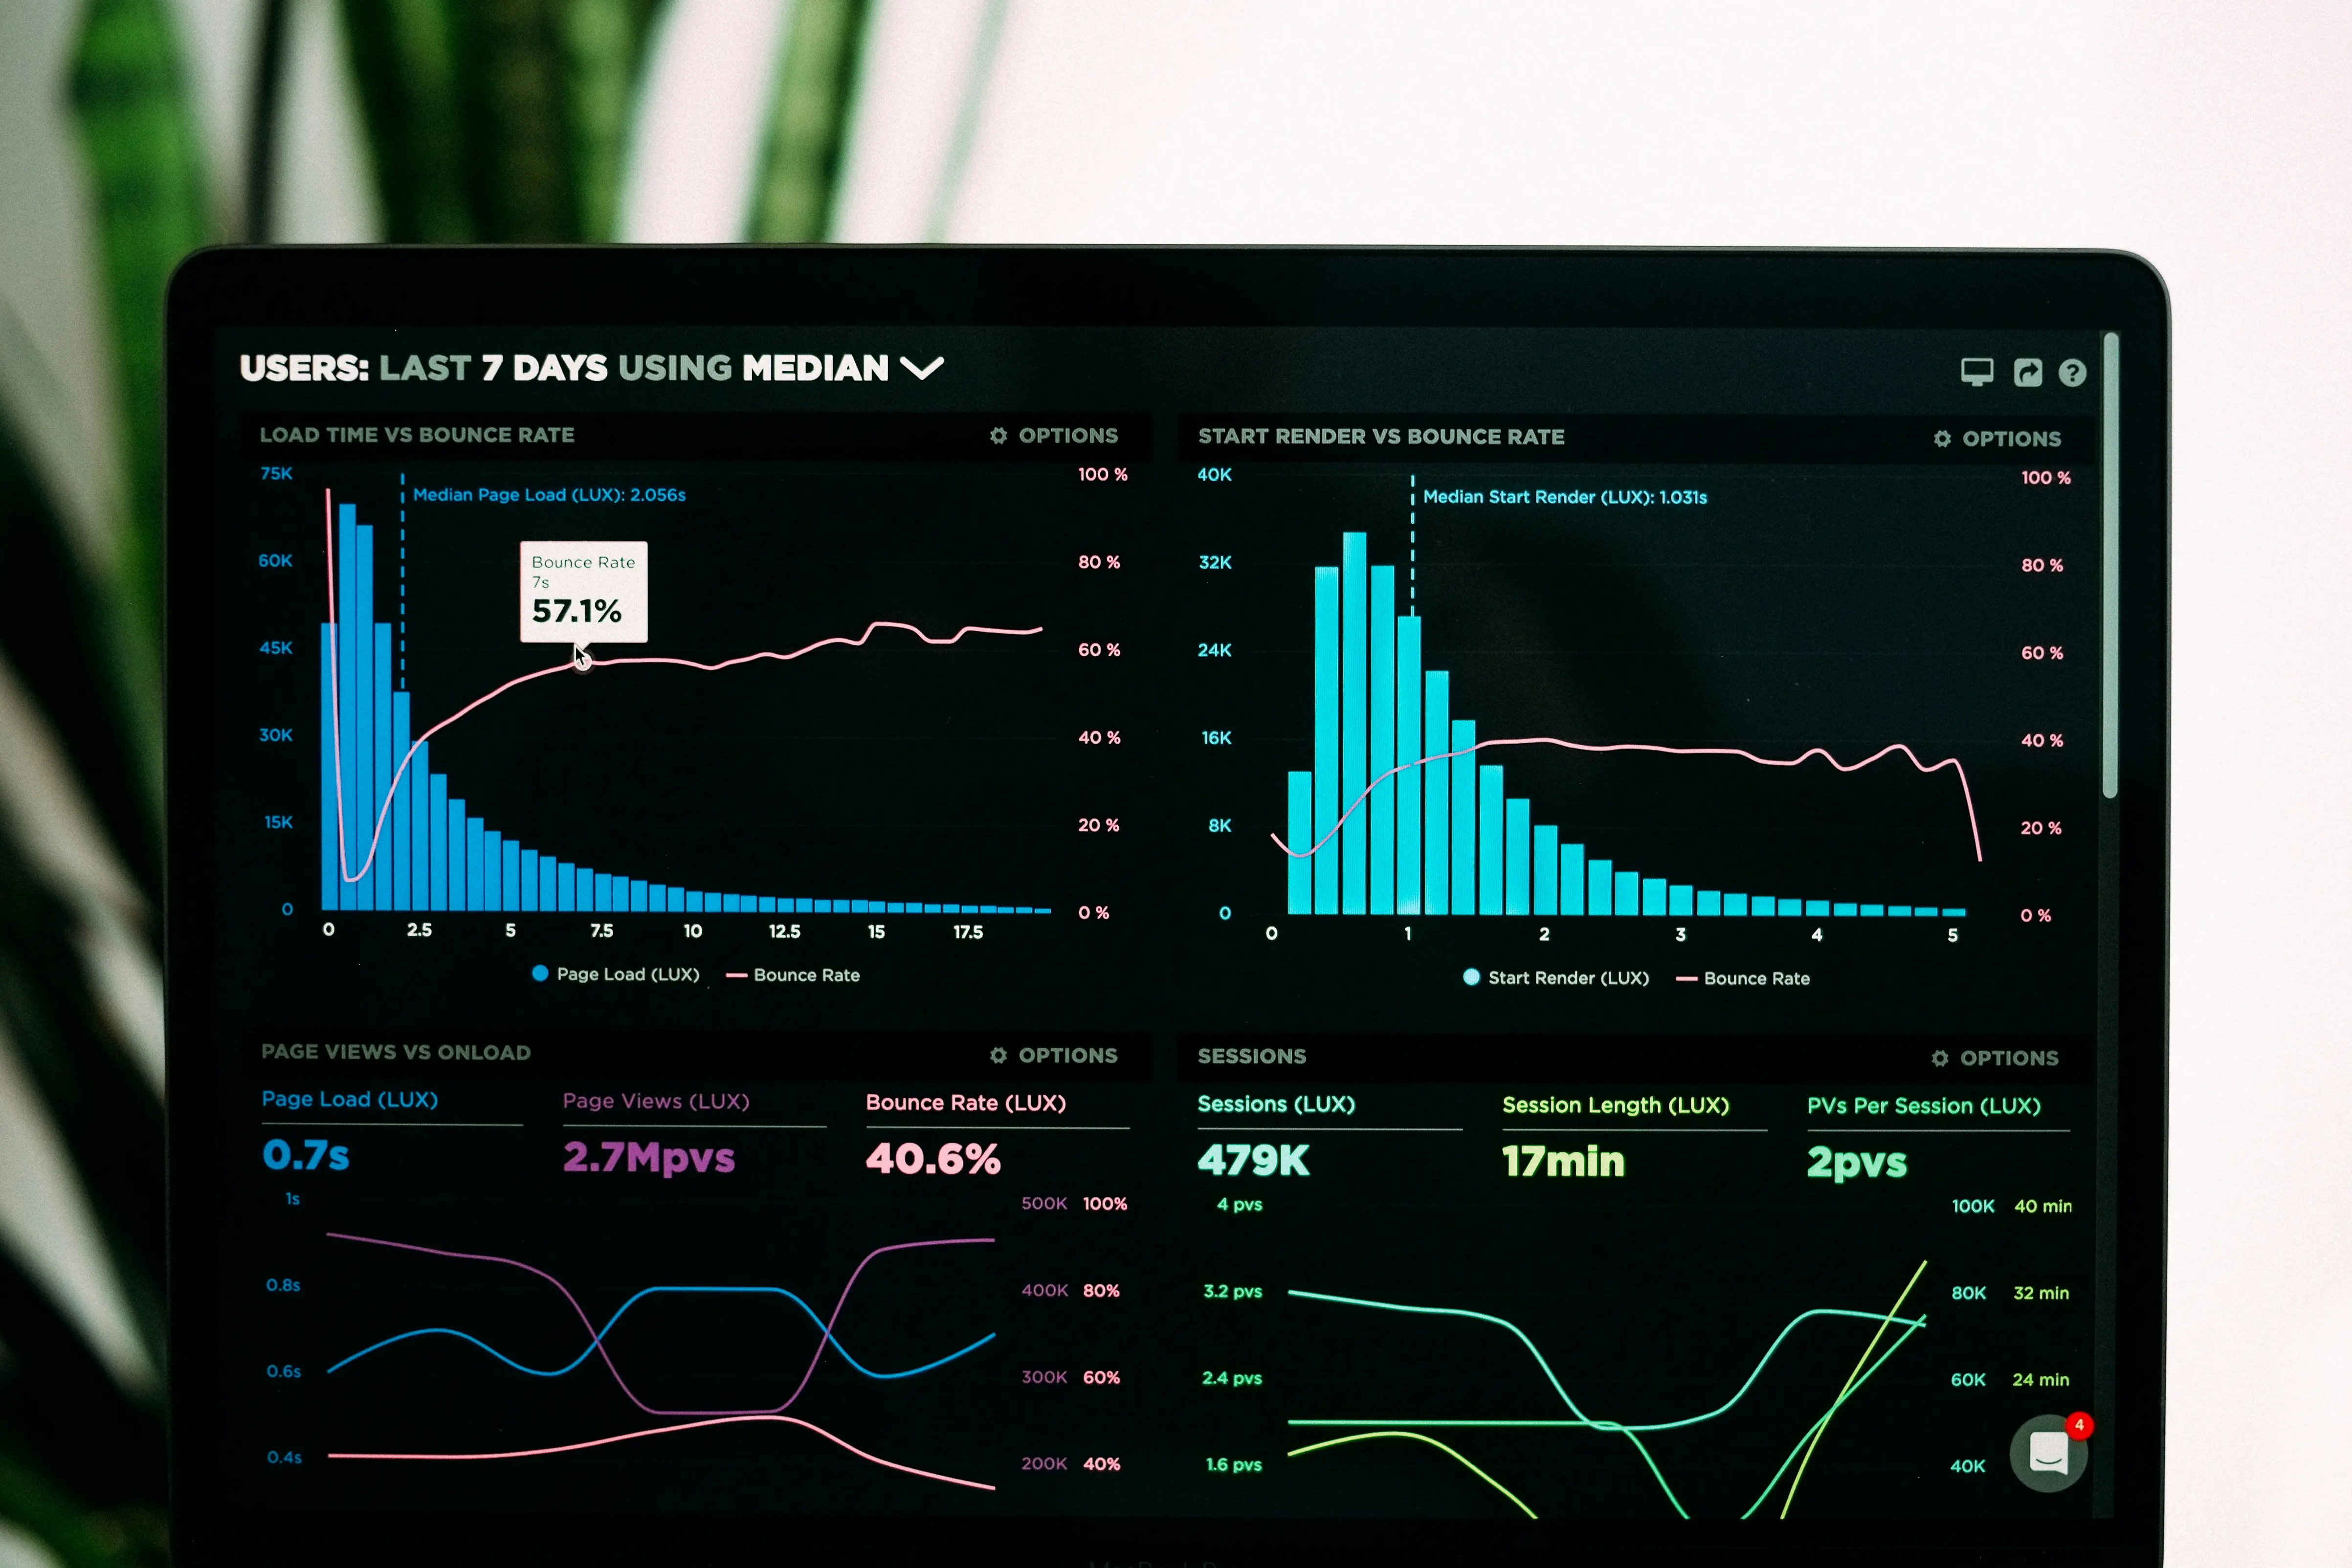
In the age of digital transformation, the exponential growth in available data has revolutionized various sectors. From business, healthcare and education to public policy and environmental science, the volume and variety of data generated every day have highlighted the importance of leveraging data for decision-making.
As organizations and individuals navigate this data-rich landscape, the ability to effectively visualize data has emerged as a crucial skill and has been even more important in recent years.
Additionally, the rise of cloud computing, APIs, and integration capabilities has facilitated seamless data visualization processes. Cloud platforms provide the scalability and power needed to handle large datasets, while APIs enable the easy retrieval and integration of data from multiple sources. This technological synergy allows for more dynamic, real-time visualizations that can be shared and collaborated on across various platforms.
There has been a notable increase in data visualization projects at Marzee. We have experimented with various options but specialize in utilizing JavaScript and React-based solutions to develop real-time, interactive data visualization dashboards.
This blog post delves into why React can be a powerful tool for building dynamic data visualization interfaces.
What is Data Visualization
Data visualization simplifies and communicates data by presenting it using charts, images, numbers, and other media. It transforms complex datasets into interactive visual formats, making it easier to understand complex concepts and recognize trends, patterns, and relationships in the data. By improving data comprehension and accessibility, data visualization enhances decision-making by providing clear visual insights.
Why Use React for Data Visualization?
In this Data-driven world, JavaScript and React have emerged as powerful tools in this domain. We have listed some of the benefits we see in using React to build real-time data dashboards.
1. Rich Ecosystem and Libraries
React complements this with specialized components and libraries like Recharts, Victory and React-Vis, making it easier to create robust and flexible visualizations.
2. Component-Based Architecture
React’s component-based architecture promotes the creation of reusable, modular, and maintainable code. This is especially advantageous for complex data visualization interfaces, where different types of charts and components can be seamlessly integrated and managed.
3. Declarative Syntax
React’s declarative approach simplifies the process of managing the state of your application. This is crucial for dynamic and interactive visualizations, as it allows you to describe how the User Interface should appear at any given moment, with React handling the updates efficiently.
4. Performance Optimization
React includes built-in performance optimization techniques, which efficiently update and render components. This is particularly beneficial for data visualization applications that require frequent updates and re-renders.
5. Integration with Other Technologies
React can easily integrate with various technologies and frameworks, such as Redux for state management, WebSockets for real-time data updates, and APIs for fetching data. This flexibility enables the creation of comprehensive, data-driven applications.
6. Community and Support
React has a large and very active community. This translates to a wealth of resources, tutorials, forums, and third-party libraries to help you tackle any challenges and enhance your data visualization projects.
7. Interactive and Dynamic Visualizations
React enables the creation of highly interactive and dynamic visualizations. Features like tooltips, zooming, panning, and real-time data updates can be easily implemented, significantly enhancing the user experience.
9. Scalability
React applications are highly scalable. As your data grows and your visualizations become more complex, React’s architecture helps manage this complexity without sacrificing performance.
10. Conditional Rendering
React's powerful conditional rendering capabilities allow you to display different visualizations or modify their structure based on the screen size. For instance, you might show a detailed bar chart on larger screens and a simplified version or a summary on smaller screens
Using React for data visualization interfaces provides a powerful combination of flexibility, performance, and developer productivity. Whether you’re creating dashboards, data analysis tools, or interactive reports, these technologies offer the tools you need to build modern, engaging, and efficient data visualization applications.
We have recently worked in collaboration with Discriminology and Major to build a Data-driven web application to address racial inequity in schools in the USA.
The product enables schools and parents from the community to easily undertake surveys with students and instantly see the results in an intuitive dashboard.
The project's data visualisation approach allows users to see details about the survey scores and a list of recommendations for tackling any possible racial inequity issues.

We used Recharts to build the charts in the dashboard. It’s a good React library all-around: it has good documentation (both for APIs as it’s built with TypeScript and code usage). It handles different types of representations (Pie, Circular, Bar, Scatter etc.), which makes it a good choice for the future. Furthermore, it’s built on solid grounds (as it’s using both React and D3 under the hood).
Check out the Case Study with details about this project.
